Go provides benchmarking feature, along with fuzzy tests on the testing package.
BenchX(b *testing.B) {
	for B.L {
		// do your thing
		fmt.Println("doing thing")
	}
}
The benchmark loops for some N times.
You can additionally leverage benchtime parameter to reduce the skew
CPU Profiling
Go provides profiling along with benchmarking tools. The tag cpuprofile provides you to export the cpu profile to a pprof file, which is only a convention
go test -bench . -cpuprofile cpu.pprofThe profile file can be analysed with pprof tool that comes builtin with go tools.
go tool pprof cpu.pprof
(pprof) top
Showing nodes accounting for 2.06s, 97.63% of 2.11s total
Dropped 33 nodes (cum <= 0.01s)
Showing top 10 nodes out of 70
      flat  flat%   sum%        cum   cum%
     1.79s 84.83% 84.83%      1.79s 84.83%  syscall.syscall
     0.07s  3.32% 88.15%      0.07s  3.32%  runtime.memmove
     0.06s  2.84% 91.00%      0.06s  2.84%  runtime.usleep
     0.05s  2.37% 93.36%      0.05s  2.37%  runtime.madvise
     0.04s  1.90% 95.26%      0.04s  1.90%  runtime.pthread_cond_signal
     0.02s  0.95% 96.21%      0.02s  0.95%  colstats.sum
     0.02s  0.95% 97.16%      0.02s  0.95%  runtime.newArenaMayUnlock
     0.01s  0.47% 97.63%      0.02s  0.95%  runtime.mallocgc
         0     0% 97.63%      1.14s 54.03%  bufio.(*Reader).ReadSlice
         0     0% 97.63%      1.14s 54.03%  bufio.(*Reader).fill
However the top -cum provides a cumulative view on the list of functions, which could be useful for letting us know which function spends most time in the cpu.
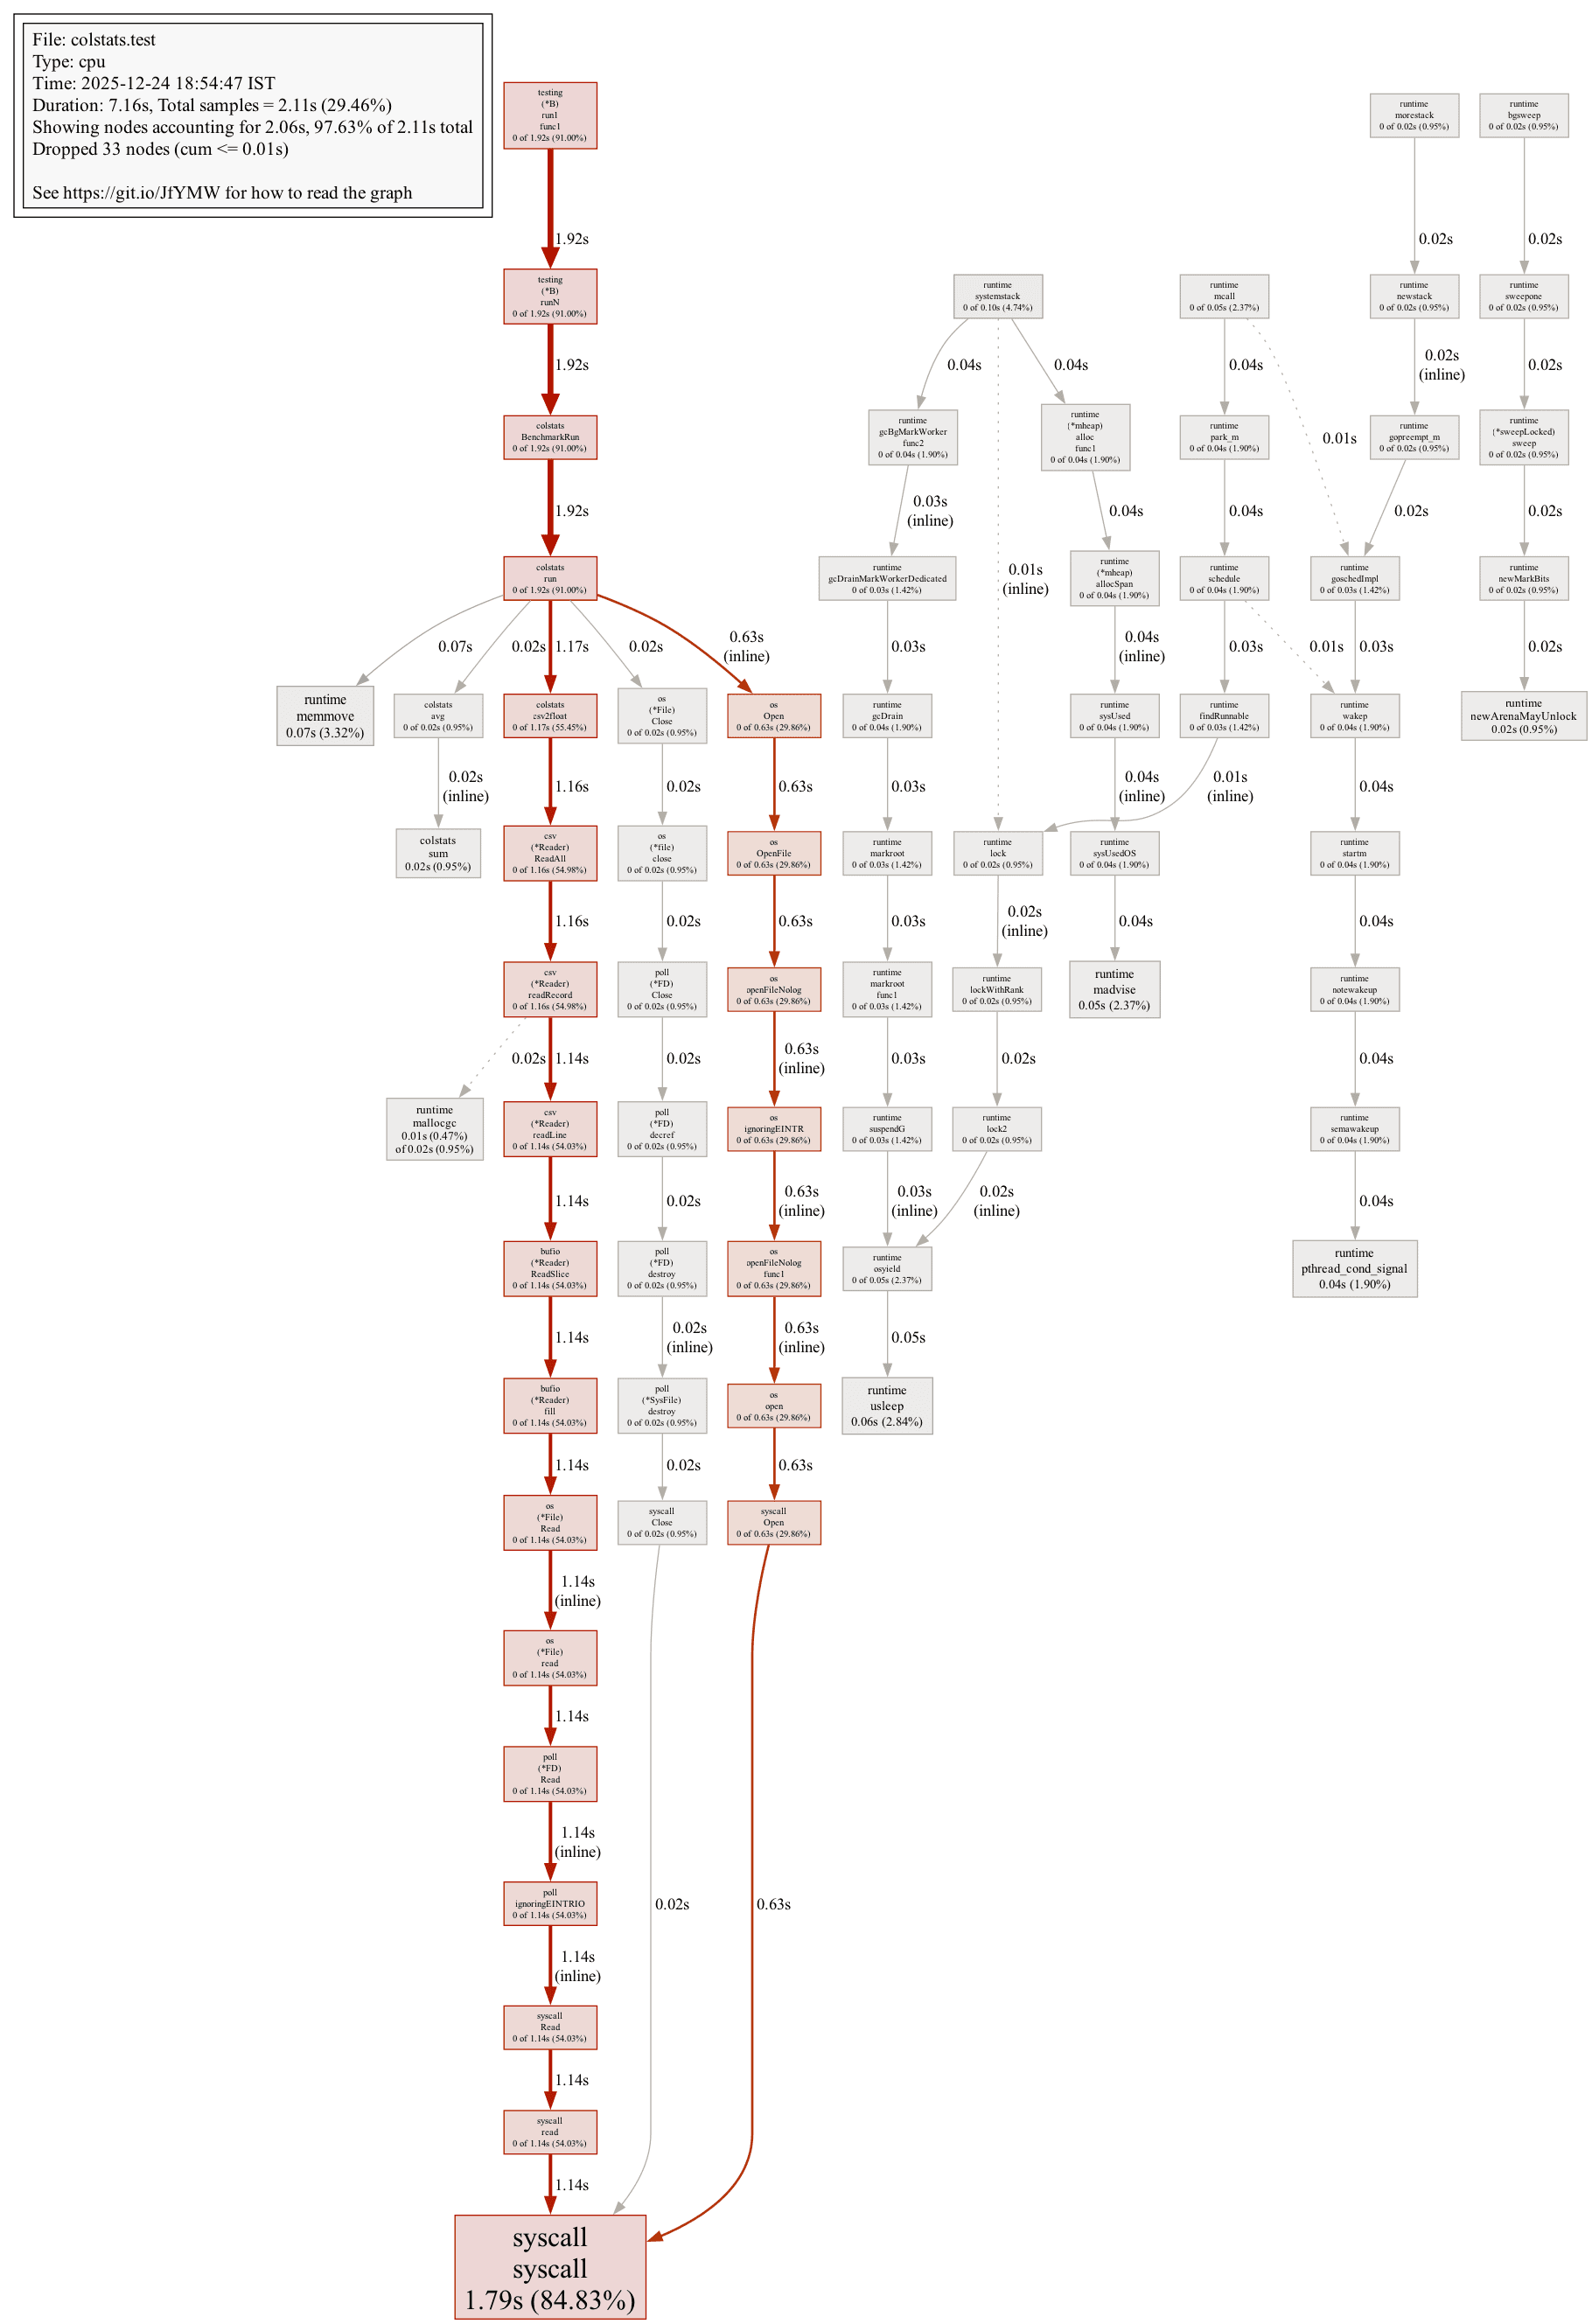
The web subcommand opens a graphed relation between functions with benchmark data. One important detail to notices is, the path that is colored red is the hot path, that’s where the program spends most of the time often
Memory profiling