collectd & statsd
collectd
- A daemon that collects system metrics (disk, memory, network, etc.)
- Runs locally and sends data to CloudWatch Agent
- CloudWatch Agent parses its output
- You’ll need to integrate with the config.json
- CloudWatch agent listens on UDP 25826 for collectd.
...
LoadPlugin network
<Plugin network>
  Server "127.0.0.1" "25826"
</Plugin>
...
// config.json
"metrics": {
"metrics_collected": {
"collectd": {},
}
}
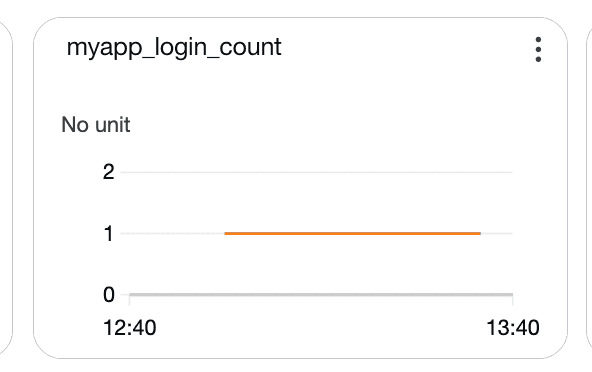
statsd
- A UDP-based protocol for custom application metrics
- CloudWatch Agent can run a statsd listener on port 8125
- Your app sends metrics like
page_load_time:300|msorusers:5|gvia UDP - You can simulate statdsd metrics maybe with a cron job
"statsd": {
  "service_address": ":8125",
  "metrics_collection_interval": 60,
  "metrics_aggregation_interval": 60
}
I’ve configured a cron job to hit the port cw-agent is listening on
#!/bin/bash
echo "myapp.login.count:1|c" | nc -u -w0 127.0.0.1 8125