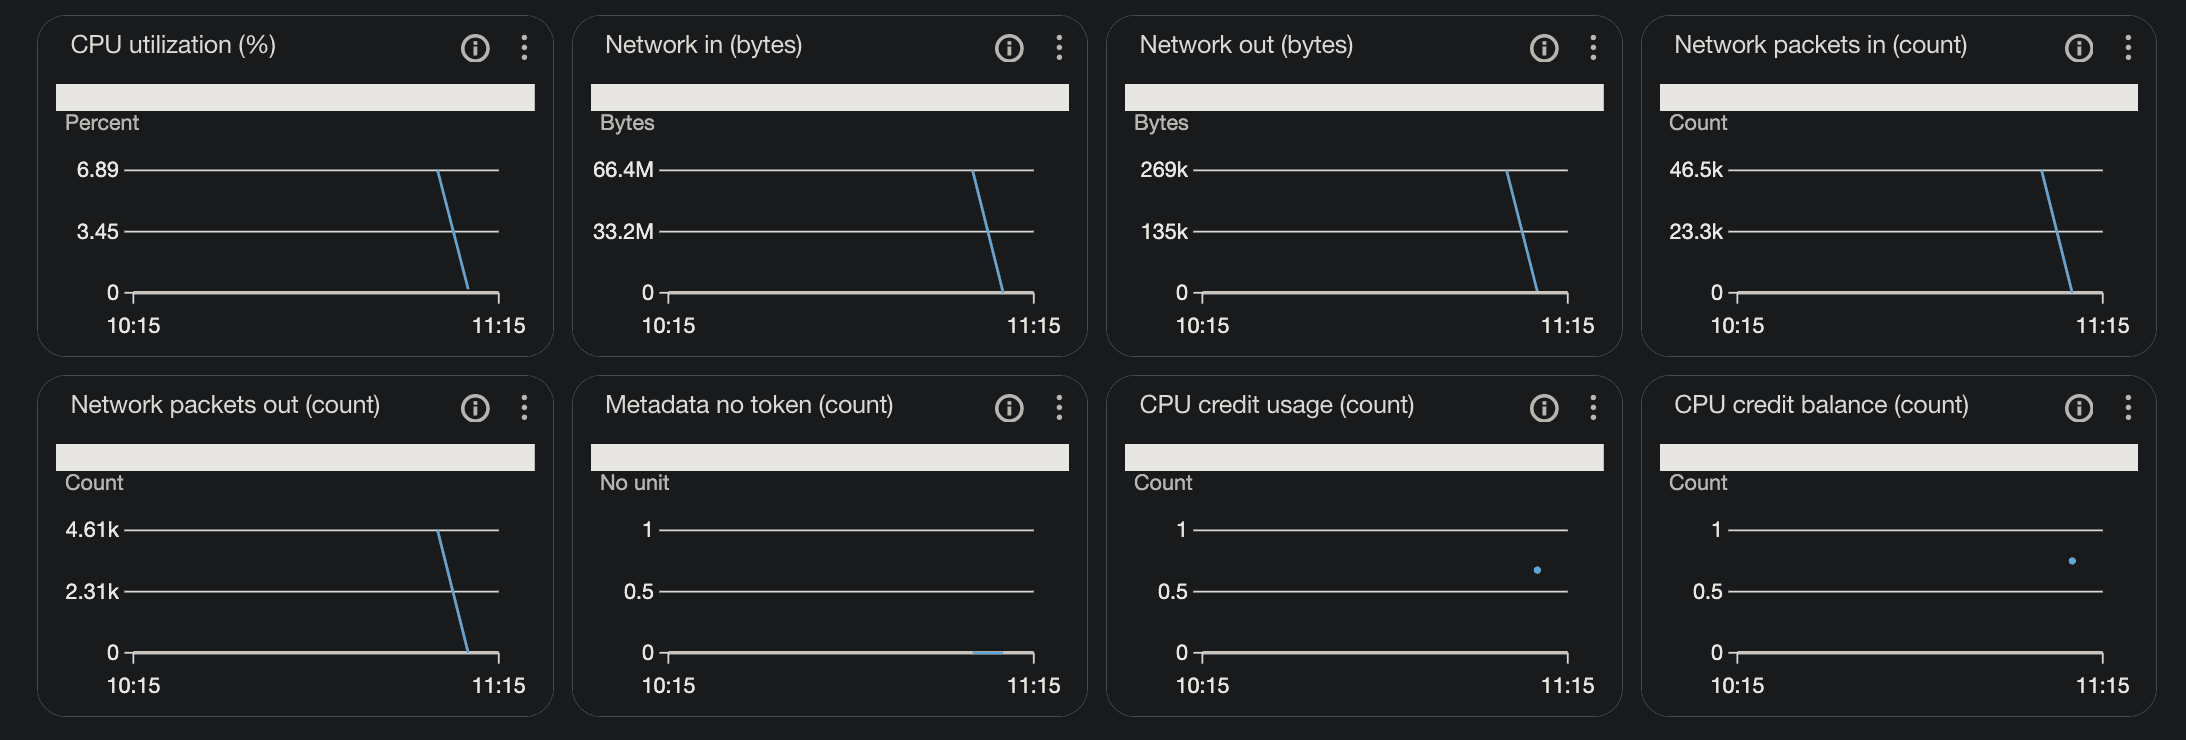
sudo /opt/aws/amazon-cloudwatch-agent/bin/amazon-cloudwatch-agent-ctl -m ec2 -a status
Result
You’ll need to configure collectd and statsd options to maybe get more metrics
Sample configuration
================================================================
= Welcome to the Amazon CloudWatch Agent Configuration Manager =
= =
= CloudWatch Agent allows you to collect metrics and logs from =
= your host and send them to CloudWatch. Additional CloudWatch =
= charges may apply. =
================================================================
On which OS are you planning to use the agent?
1. linux
2. windows
3. darwin
default choice: [1]:
1
Trying to fetch the default region based on ec2 metadata...
I! imds retry client will retry 1 timesAre you using EC2 or On-Premises hosts?
1. EC2
2. On-Premises
default choice: [1]:
1
Which user are you planning to run the agent?
1. cwagent
2. root
3. others
default choice: [1]:
Do you want to turn on StatsD daemon?
1. yes
2. no
default choice: [1]:
Which port do you want StatsD daemon to listen to?
default choice: [8125]
What is the collect interval for StatsD daemon?
1. 10s
2. 30s
3. 60s
default choice: [1]:
What is the aggregation interval for metrics collected by StatsD daemon?
1. Do not aggregate
2. 10s
3. 30s
4. 60s
default choice: [4]:
Do you want to monitor metrics from CollectD? WARNING: CollectD must be installed or the Agent will fail to start
1. yes
2. no
default choice: [1]:
Do you want to monitor any host metrics? e.g. CPU, memory, etc.
1. yes
2. no
default choice: [1]:
Do you want to monitor cpu metrics per core?
1. yes
2. no
default choice: [1]:
Do you want to add ec2 dimensions (ImageId, InstanceId, InstanceType, AutoScalingGroupName) into all of your metrics if the info is available?
1. yes
2. no
default choice: [1]:
Do you want to aggregate ec2 dimensions (InstanceId)?
1. yes
2. no
default choice: [1]:
Would you like to collect your metrics at high resolution (sub-minute resolution)? This enables sub-minute resolution for all metrics, but you can customize for specific metrics in the output json file.
1. 1s
2. 10s
3. 30s
4. 60s
default choice: [4]:
Which default metrics config do you want?
1. Basic
2. Standard
3. Advanced
4. None
default choice: [1]:
Current config as follows:
{
"agent": {
"metrics_collection_interval": 60,
"run_as_user": "cwagent"
},
"metrics": {
"aggregation_dimensions": [
[
"InstanceId"
]
],
"append_dimensions": {
"AutoScalingGroupName": "${aws:AutoScalingGroupName}",
"ImageId": "${aws:ImageId}",
"InstanceId": "${aws:InstanceId}",
"InstanceType": "${aws:InstanceType}"
},
"metrics_collected": {
"collectd": {
"metrics_aggregation_interval": 60
},
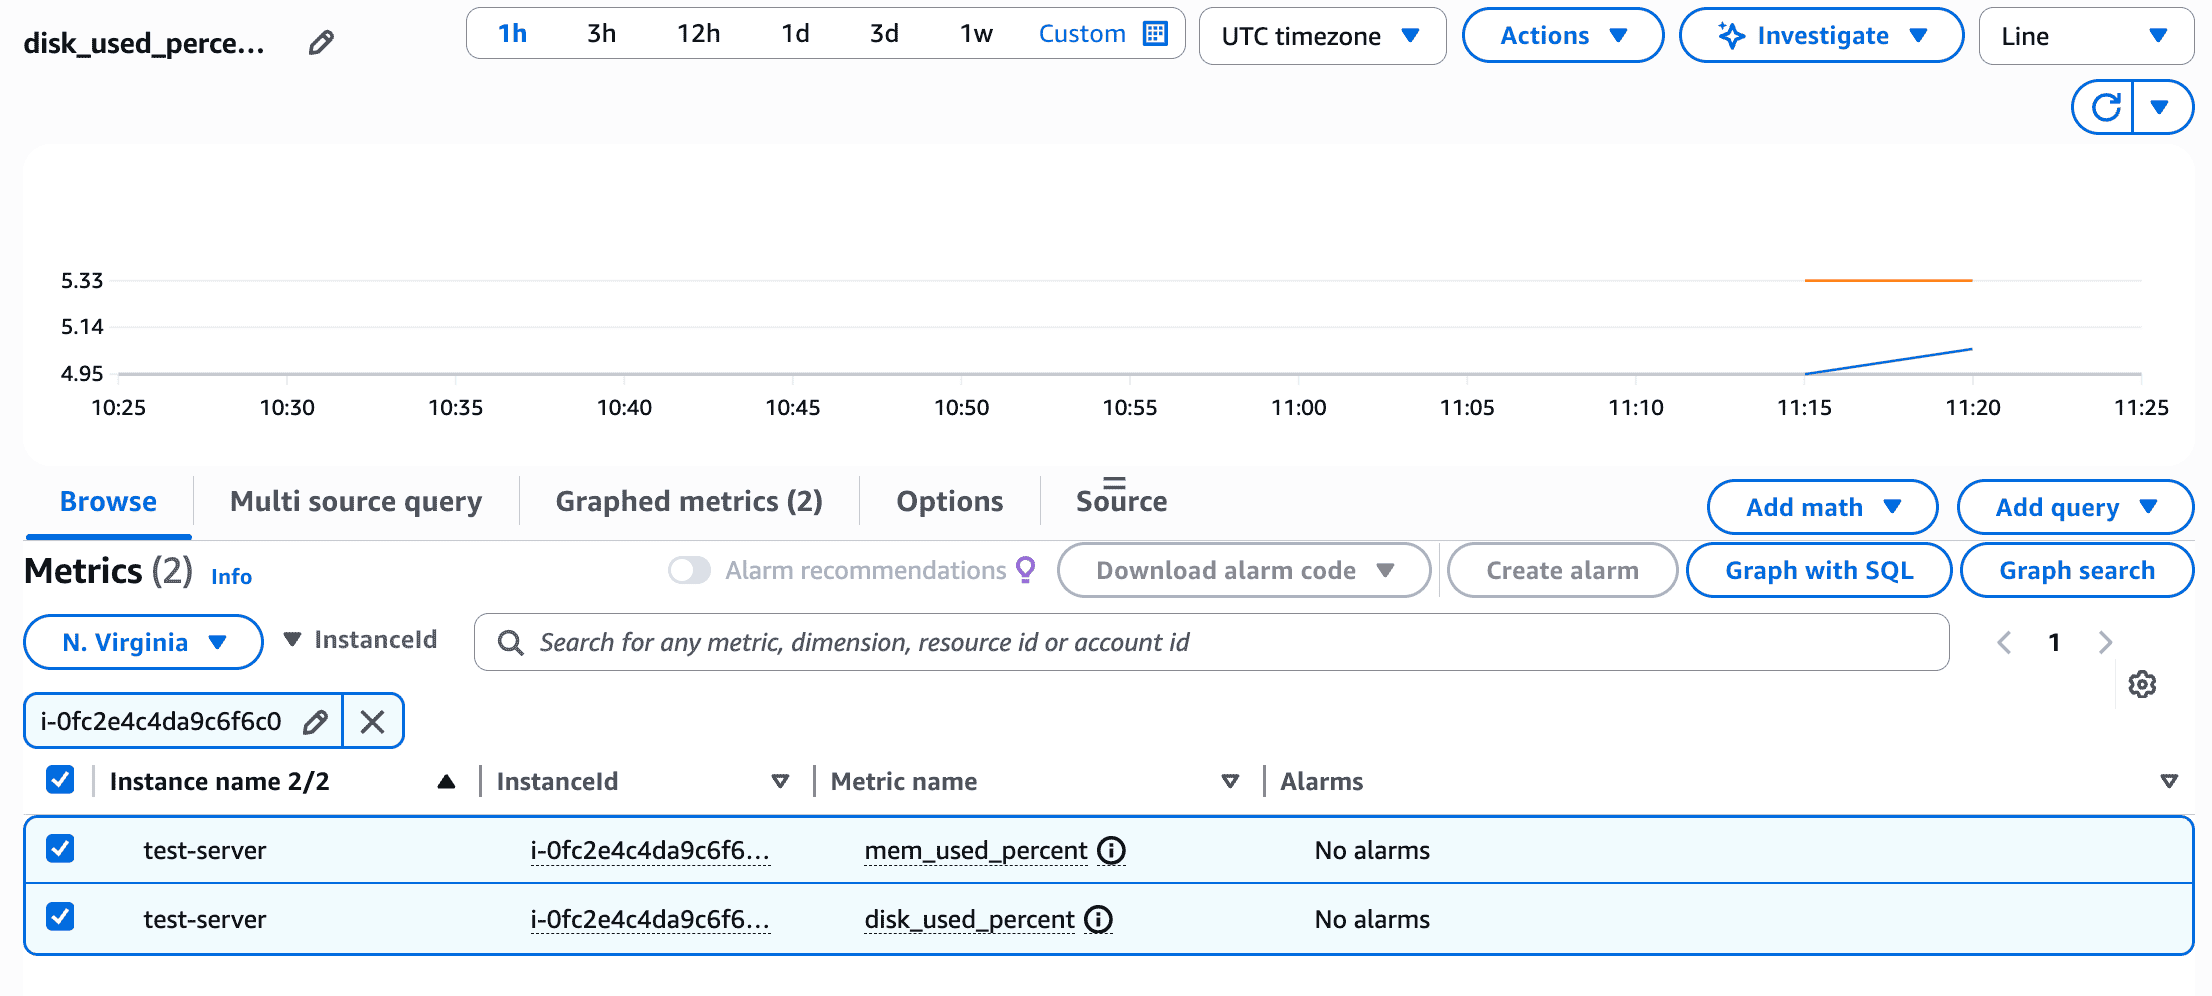
"disk": {
"measurement": [
"used_percent"
],
"metrics_collection_interval": 60,
"resources": [
"*"
]
},
"mem": {
"measurement": [
"mem_used_percent"
],
"metrics_collection_interval": 60
},
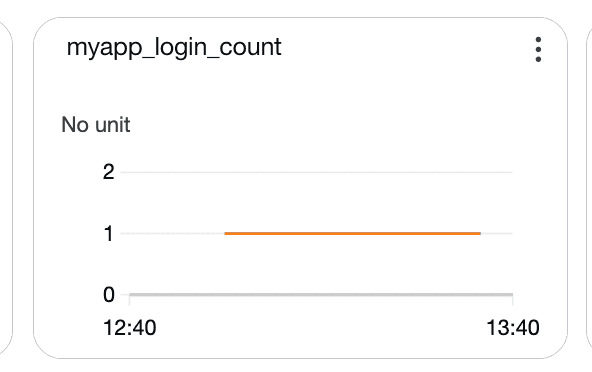
"statsd": {
"metrics_aggregation_interval": 60,
"metrics_collection_interval": 10,
"service_address": ":8125"
}
}
}
}
Are you satisfied with the above config? Note: it can be manually customized after the wizard completes to add additional items.
1. yes
2. no
default choice: [1]:
Do you have any existing CloudWatch Log Agent (http://docs.aws.amazon.com/AmazonCloudWatch/latest/logs/AgentReference.html) configuration file to import for migration?
1. yes
2. no
default choice: [2]:
Do you want to monitor any log files?
1. yes
2. no
default choice: [1]:
2
Do you want the CloudWatch agent to also retrieve X-ray traces?
1. yes
2. no
default choice: [1]:
2
Existing config JSON identified and copied to: /opt/aws/amazon-cloudwatch-agent/etc/backup-configs
Saved config file to /opt/aws/amazon-cloudwatch-agent/bin/config.json successfully.
Current config as follows:
{
"agent": {
"metrics_collection_interval": 60,
"run_as_user": "cwagent"
},
"metrics": {
"aggregation_dimensions": [
[
"InstanceId"
]
],
"append_dimensions": {
"AutoScalingGroupName": "${aws:AutoScalingGroupName}",
"ImageId": "${aws:ImageId}",
"InstanceId": "${aws:InstanceId}",
"InstanceType": "${aws:InstanceType}"
},
"metrics_collected": {
"collectd": {
"metrics_aggregation_interval": 60
},
"disk": {
"measurement": [
"used_percent"
],
"metrics_collection_interval": 60,
"resources": [
"*"
]
},
"mem": {
"measurement": [
"mem_used_percent"
],
"metrics_collection_interval": 60
},
"statsd": {
"metrics_aggregation_interval": 60,
"metrics_collection_interval": 10,
"service_address": ":8125"
}
}
}
}
Please check the above content of the config.
The config file is also located at /opt/aws/amazon-cloudwatch-agent/bin/config.json.
Edit it manually if needed.
Do you want to store the config in the SSM parameter store?
1. yes
2. no
default choice: [1]:
2
Program exits now.
cloudwatch-agent-ctl
Common flags:
-a → Action (start, stop, status, fetch-config, append-config)